市值效应与规模因子
薛英杰 / 2022-06-22
读入收益率和Fama-French 五因子数据,分别按照滞后一期的总市值和流通市值分组,统计组合等权收益和对应市值加权收益,并计算市值最小组与市值最大组的收益差。
下面的结果分别为全样本和子样本的累计收益表现和Fama-French因子模型回归,回归方程左手边为小市值组合与大市值组合收益差,右手边为市场(RiskPremiu)、市值(SMB)、价值(HML)、投资(CMA)、盈利(RMW)五个因子。
总市值分组(全样本)
pacman::p_load(data.table,stringr,dplyr,foreign,flextable)
options(warn = F)
fivefactort<-read.dbf("E:/科研/五因子模型指标(月)150835535/STK_MKT_FIVEFACMONTH.dbf")%>% ## 读入月度Fama-French五因子
  filter(Markettype=="P9714"&Portfolios==2)
## Field name: 'RiskPremiu' changed to: 'RiskPremiu.1'
stockret<-read.dbf("E:/科研/五因子模型指标(月)150835535/TRD_Mnth.dbf")                ##股票市值和收益数据

cleandata<-stockret%>%filter(as.character(Trdmnt)>="1995-01"&!str_detect(Stkcd,"^900|^200"))%>%
  group_by(Stkcd)%>%
  mutate(LMsmvosd=lag(Msmvosd),
  LMsmvttl=lag(Msmvttl))%>%ungroup()%>%filter(!is.na(LMsmvosd)&!is.na(LMsmvttl))%>%ungroup()%>%
  group_by(Trdmnt)%>%
  mutate(Groupsd=cut(LMsmvosd,c(min(LMsmvosd,na.rm=T)-100,quantile(LMsmvosd,seq(0.1,0.9,0.1),na.rm=T),max(LMsmvosd,na.rm=T)+100),labels=1:10),
  Groupmvt=cut(LMsmvttl,c(min(LMsmvttl,na.rm=T)-100,quantile(LMsmvttl,seq(0.1,0.9,0.1),na.rm=T),max(LMsmvttl,na.rm=T)+100),labels=1:10))%>%
  select(Stkcd,Trdmnt,Groupsd,Groupmvt,Msmvttl,LMsmvttl,Mretnd)%>%
  ungroup()%>%
  na.omit()


Mvtotal<-cleandata%>%group_by(Trdmnt,Groupmvt)%>%
  summarise(Eqret=mean(Mretnd),Wiehtret=weighted.mean(Mretnd,LMsmvttl))%>%
  filter(Groupmvt%in%c(1,10))%>%
  as.data.frame()%>%
  reshape(idvar = "Trdmnt",timevar = "Groupmvt",direction = "wide")%>%
  mutate(E10_1=Eqret.1-Eqret.10,
  W10_1=Wiehtret.1-Wiehtret.10)
## `summarise()` has grouped output by 'Trdmnt'. You can override using the
## `.groups` argument.
所有时间
factmerg<-Mvtotal%>%
  mutate(TradingMon=Trdmnt)%>%
  merge(fivefactort,by="TradingMon",all.x = T)%>%
  mutate(cumretE10_1=cumsum(E10_1),
  cumretE10=cumsum(Eqret.10),
  cumretE1=cumsum(Eqret.1),
  cumSMB=cumsum(SMB2))
plot(factmerg$cumretE10_1,type="l",axes = F,ylab="累计收益",xlab="时间",lwd=2,ylim=c(-2,15))
axis(side =1,at=seq(1,length(factmerg$Trdmnt),50),
as.character(factmerg$Trdmnt[seq(1,length(factmerg$Trdmnt),50)]))
axis(side =2,at=seq(-2,15,3),seq(-2,15,3))
box(lty = "solid")
lines(factmerg$cumretE10,col="blue",lwd=2)
lines(factmerg$cumretE1,col="orange",lwd=2)
legend(0,25,c("S-B","B","S"),lty=c(1,1,1),lwd=c(2,2,2),
  horiz = T,col = c("black","blue","orange"),border=F)

summary(lm(E10_1~RiskPremiu+SMB2+HML2+RMW2+CMA2,factmerg)) ##等权收益回归
##
## Call:
## lm(formula = E10_1 ~ RiskPremiu + SMB2 + HML2 + RMW2 + CMA2,
##     data = factmerg)
##
## Residuals:
##      Min       1Q   Median       3Q      Max
## -0.14936 -0.02634 -0.00642  0.01990  0.34556
##
## Coefficients:
##              Estimate Std. Error t value Pr(>|t|)
## (Intercept)  0.021229   0.002725   7.790  9.3e-14 ***
## RiskPremiu  -0.077854   0.034778  -2.239  0.02586 *
## SMB2         1.318360   0.075030  17.571  < 2e-16 ***
## HML2         0.081378   0.116578   0.698  0.48565
## RMW2        -0.412638   0.148000  -2.788  0.00562 **
## CMA2         0.245847   0.156337   1.573  0.11681
## ---
## Signif. codes:  0 '***' 0.001 '**' 0.01 '*' 0.05 '.' 0.1 ' ' 1
##
## Residual standard error: 0.04796 on 322 degrees of freedom
## Multiple R-squared:  0.6929,	Adjusted R-squared:  0.6881
## F-statistic: 145.3 on 5 and 322 DF,  p-value: < 2.2e-16
##总市值加权收益回归
分时间段
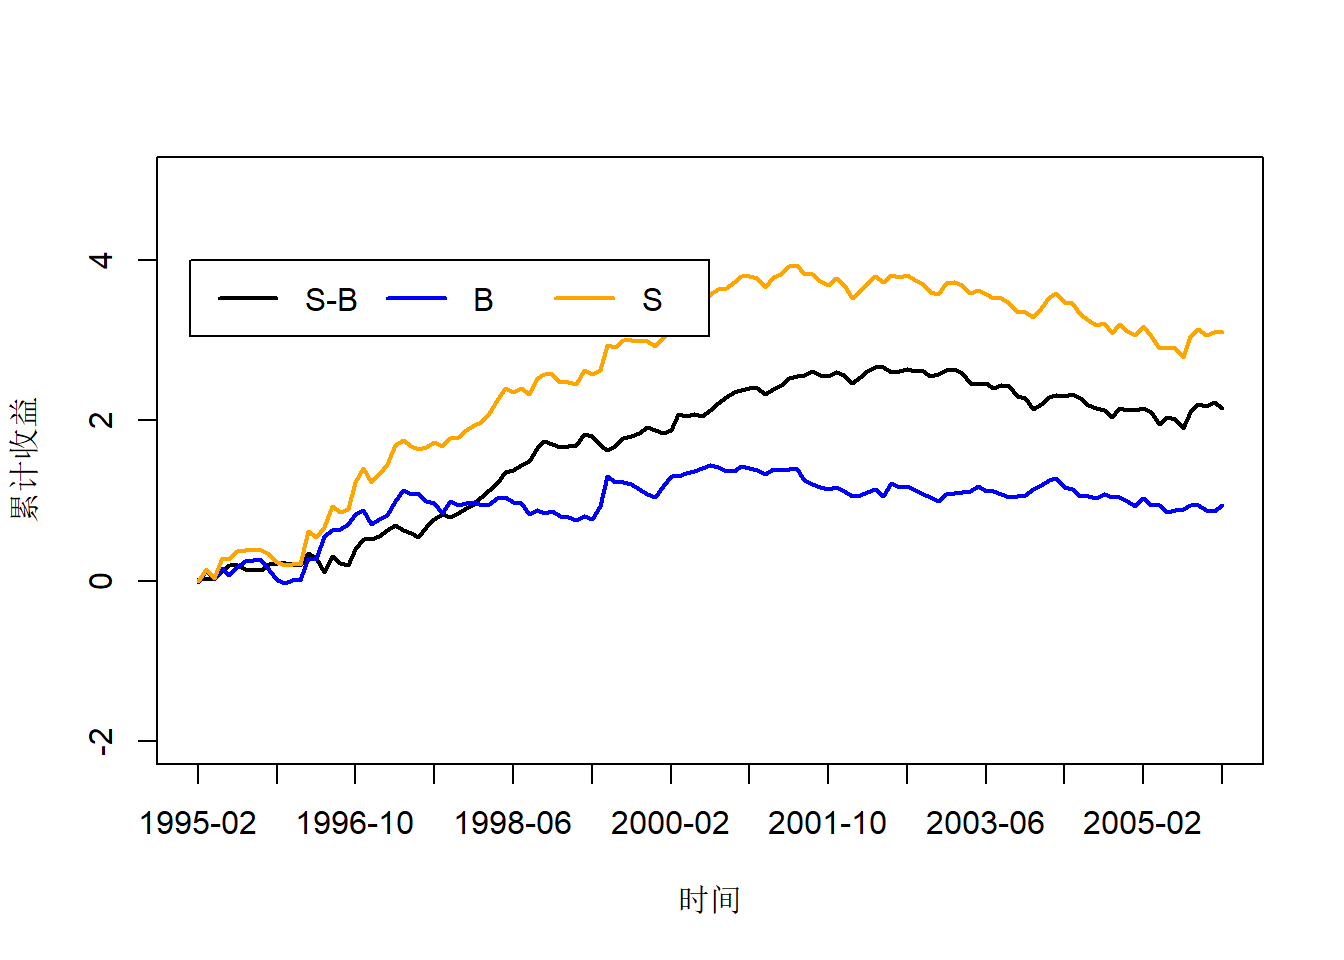
1995年1月至2005年12月
summary(lm(E10_1~RiskPremiu+SMB2+HML2+RMW2+CMA2,factmerg)) ##等权收益回归
##
## Call:
## lm(formula = E10_1 ~ RiskPremiu + SMB2 + HML2 + RMW2 + CMA2,
##     data = factmerg)
##
## Residuals:
##       Min        1Q    Median        3Q       Max
## -0.046882 -0.014050 -0.004811  0.010895  0.104563
##
## Coefficients:
##             Estimate Std. Error t value Pr(>|t|)
## (Intercept)  0.01240    0.00231   5.368 3.74e-07 ***
## RiskPremiu  -0.03232    0.02831  -1.142 0.255746
## SMB2         1.41462    0.05860  24.138  < 2e-16 ***
## HML2        -0.38593    0.10469  -3.687 0.000337 ***
## RMW2        -0.35391    0.09262  -3.821 0.000208 ***
## CMA2         0.59113    0.11155   5.299 5.08e-07 ***
## ---
## Signif. codes:  0 '***' 0.001 '**' 0.01 '*' 0.05 '.' 0.1 ' ' 1
##
## Residual standard error: 0.02529 on 125 degrees of freedom
## Multiple R-squared:  0.8833,	Adjusted R-squared:  0.8786
## F-statistic: 189.2 on 5 and 125 DF,  p-value: < 2.2e-16
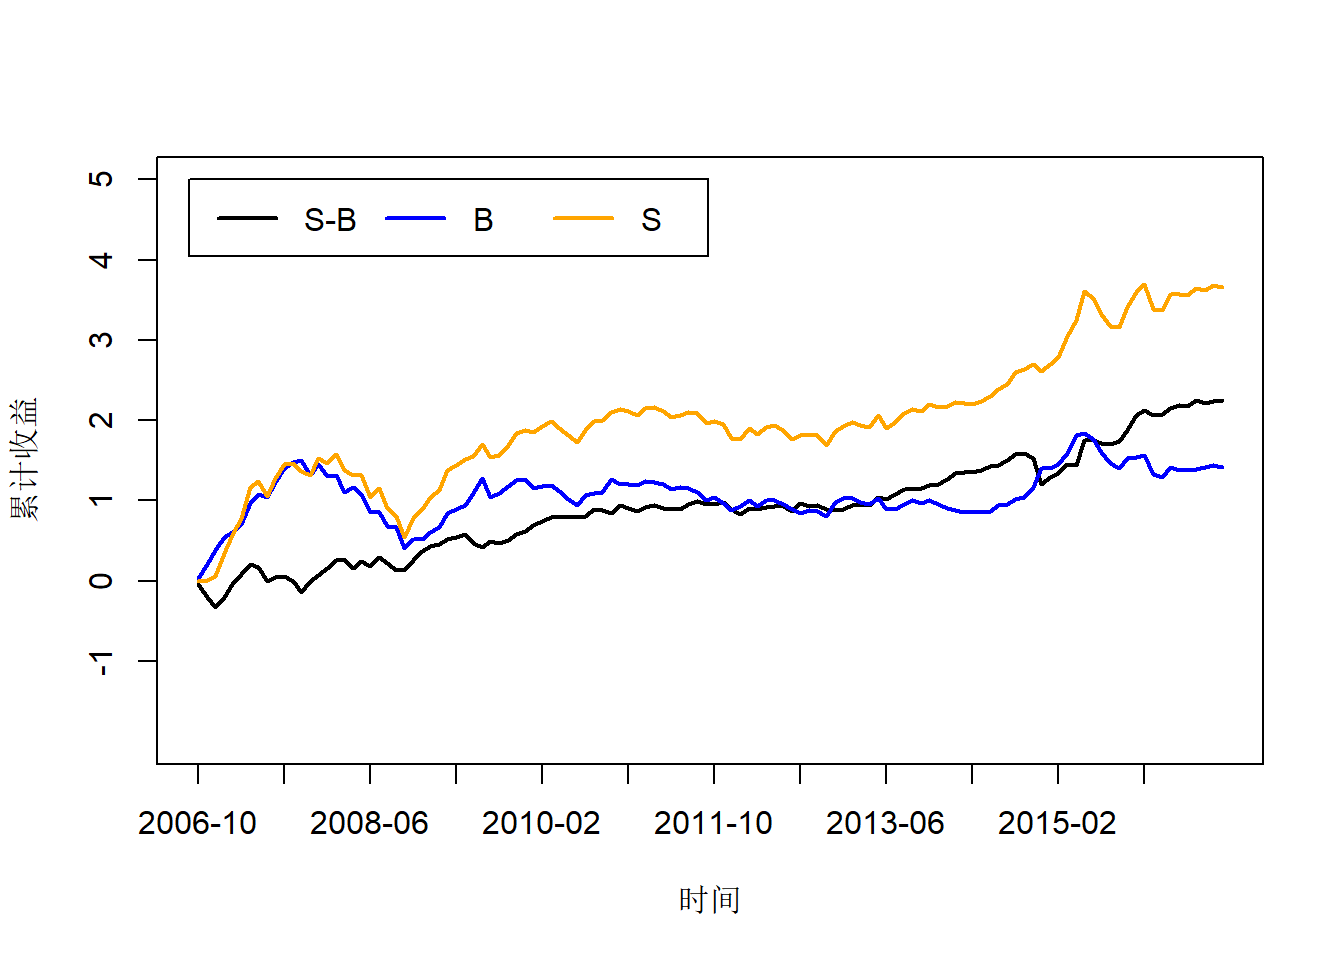
2006年1月至2015年12月
summary(lm(E10_1~RiskPremiu+SMB2+HML2+RMW2+CMA2,factmerg)) ##等权收益回归
##
## Call:
## lm(formula = E10_1 ~ RiskPremiu + SMB2 + HML2 + RMW2 + CMA2,
##     data = factmerg)
##
## Residuals:
##      Min       1Q   Median       3Q      Max
## -0.08249 -0.03088 -0.01193  0.01709  0.31430
##
## Coefficients:
##              Estimate Std. Error t value Pr(>|t|)
## (Intercept)  0.036472   0.005923   6.158 1.13e-08 ***
## RiskPremiu  -0.071207   0.066440  -1.072    0.286
## SMB2         1.358815   0.193110   7.036 1.57e-10 ***
## HML2         0.233393   0.239012   0.976    0.331
## RMW2        -0.707684   0.471518  -1.501    0.136
## CMA2        -0.665813   0.386884  -1.721    0.088 .
## ---
## Signif. codes:  0 '***' 0.001 '**' 0.01 '*' 0.05 '.' 0.1 ' ' 1
##
## Residual standard error: 0.06182 on 114 degrees of freedom
## Multiple R-squared:  0.6568,	Adjusted R-squared:  0.6417
## F-statistic: 43.63 on 5 and 114 DF,  p-value: < 2.2e-16
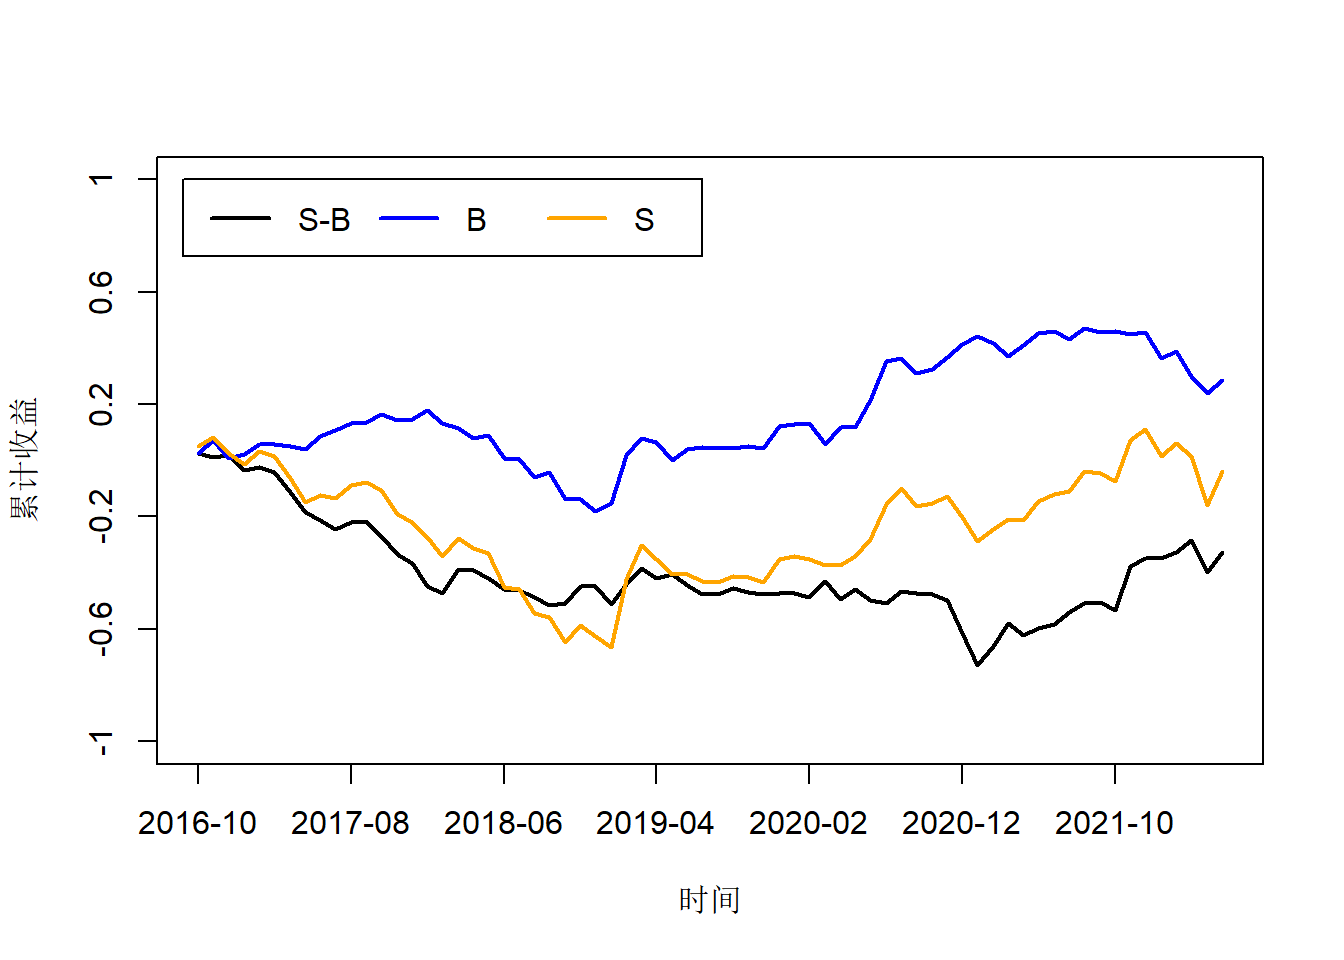
2016年1月至2022年5月
summary(lm(E10_1~RiskPremiu+SMB2+HML2+RMW2+CMA2,factmerg)) ##等权收益回归
##
## Call:
## lm(formula = E10_1 ~ RiskPremiu + SMB2 + HML2 + RMW2 + CMA2,
##     data = factmerg)
##
## Residuals:
##       Min        1Q    Median        3Q       Max
## -0.056309 -0.018623 -0.007408  0.014514  0.109780
##
## Coefficients:
##              Estimate Std. Error t value Pr(>|t|)
## (Intercept)  0.019142   0.004448   4.303 6.09e-05 ***
## RiskPremiu  -0.073366   0.110836  -0.662   0.5105
## SMB2         1.169670   0.173636   6.736 6.14e-09 ***
## HML2         0.508653   0.273223   1.862   0.0674 .
## RMW2        -0.199665   0.349910  -0.571   0.5703
## CMA2         0.666560   0.394243   1.691   0.0959 .
## ---
## Signif. codes:  0 '***' 0.001 '**' 0.01 '*' 0.05 '.' 0.1 ' ' 1
##
## Residual standard error: 0.03536 on 62 degrees of freedom
## Multiple R-squared:  0.6578,	Adjusted R-squared:  0.6301
## F-statistic: 23.83 on 5 and 62 DF,  p-value: 2.763e-13
总市值分组(市值后30%的股票)
pacman::p_load(data.table,stringr,dplyr,foreign,flextable)
options(warn = F)
fivefactort<-read.dbf("E:/科研/五因子模型指标(月)150835535/STK_MKT_FIVEFACMONTH.dbf")%>% ## 读入月度Fama-French五因子
  filter(Markettype=="P9714"&Portfolios==1)
## Field name: 'RiskPremiu' changed to: 'RiskPremiu.1'
stockret<-read.dbf("E:/科研/五因子模型指标(月)150835535/TRD_Mnth.dbf")                ##股票市值和收益数据

cleandata<-stockret%>%filter(as.character(Trdmnt)>="1995-01"&!str_detect(Stkcd,"^900|^200"))%>%
  group_by(Stkcd)%>%
  mutate(LMsmvosd=lag(Msmvosd),
  LMsmvttl=lag(Msmvttl))%>%ungroup()%>%
  group_by(Trdmnt)%>%
  filter(LMsmvttl<=quantile(LMsmvttl,0.3,na.rm=T))%>%
  mutate(Groupsd=cut(LMsmvosd,c(min(LMsmvosd)-100,quantile(LMsmvosd,seq(0.1,0.9,0.1),na.rm=T),max(LMsmvosd)+100),labels=1:10),
  Groupmvt=cut(LMsmvttl,c(min(LMsmvttl)-100,quantile(LMsmvttl,seq(0.1,0.9,0.1),na.rm=T),max(LMsmvttl)+100),labels=1:10))%>%
  select(Stkcd,Trdmnt,Groupsd,Groupmvt,Msmvttl,LMsmvttl,Mretnd)%>%
  ungroup()%>%
  na.omit()


Mvtotal<-cleandata%>%group_by(Trdmnt,Groupmvt)%>%
  summarise(Eqret=mean(Mretnd),Wiehtret=weighted.mean(Mretnd,LMsmvttl))%>%
  filter(Groupmvt%in%c(1,10))%>%
  as.data.frame()%>%
  reshape(idvar = "Trdmnt",timevar = "Groupmvt",direction = "wide")%>%
  mutate(E10_1=Eqret.1-Eqret.10,
  W10_1=Wiehtret.1-Wiehtret.10)
## `summarise()` has grouped output by 'Trdmnt'. You can override using the
## `.groups` argument.
所有时间(市值后30%的股票)
factmerg<-Mvtotal%>%
mutate(TradingMon=Trdmnt)%>%
merge(fivefactort,by="TradingMon",all.x = T)%>%
mutate(cumretE10_1=cumsum(E10_1),
cumretE10=cumsum(Eqret.10),
cumretE1=cumsum(Eqret.1),
cumSMB=cumsum(SMB2))
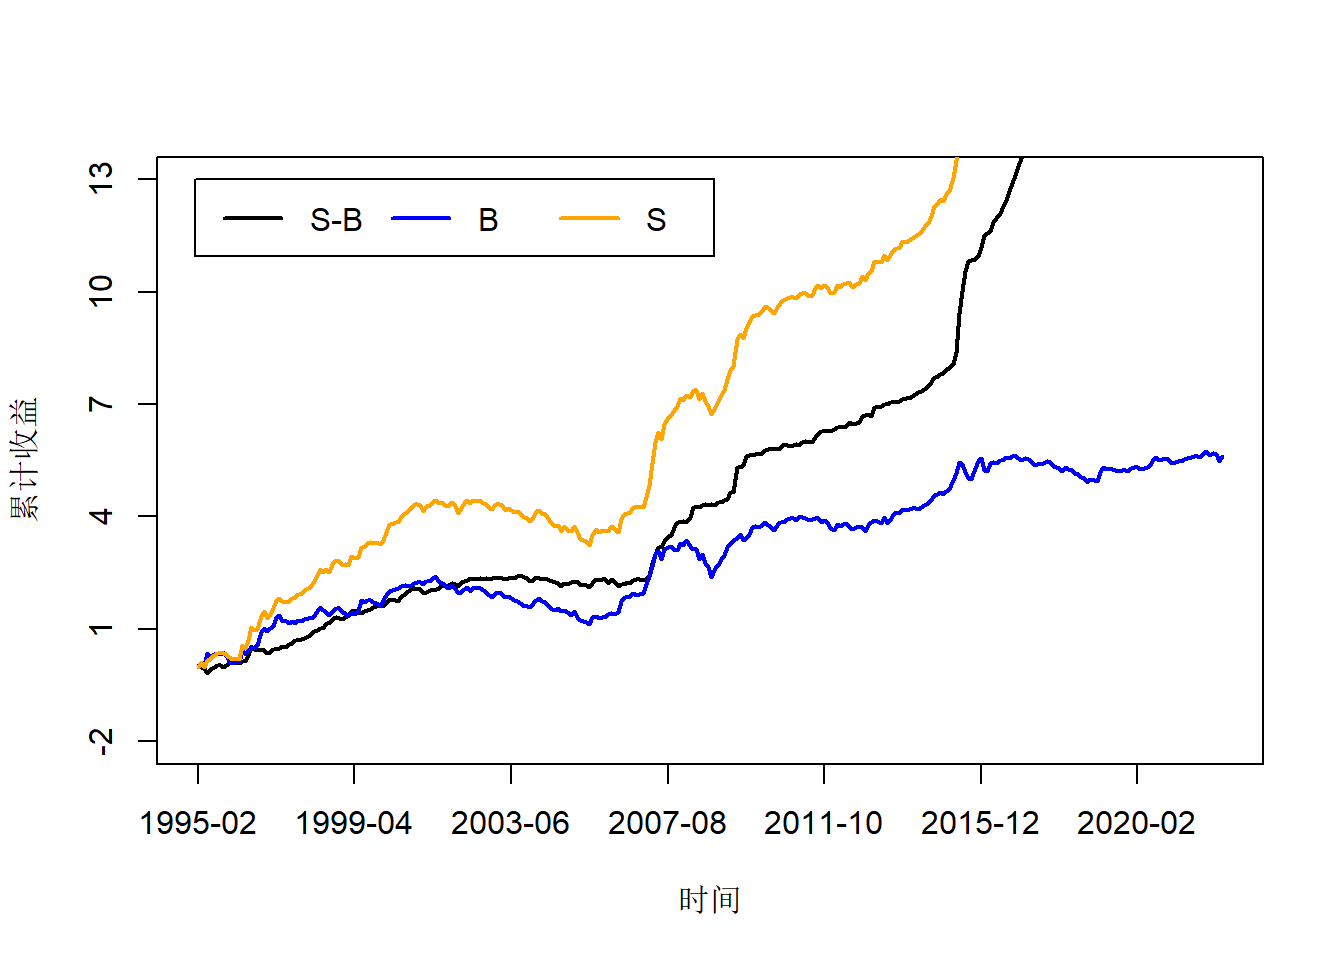
plot(factmerg$cumretE10_1,type="l",axes = F,ylab="累计收益",xlab="时间",lwd=2,ylim=c(-2,13))
axis(side =1,at=seq(1,length(factmerg$Trdmnt),50),
as.character(factmerg$Trdmnt[seq(1,length(factmerg$Trdmnt),50)]))
axis(side =2,at=seq(-2,13,3),seq(-2,13,3))
box(lty = "solid")
lines(factmerg$cumretE10,col="blue",lwd=2)
lines(factmerg$cumretE1,col="orange",lwd=2)
legend(0,13,c("S-B","B","S"),lty=c(1,1,1),lwd=c(2,2,2),
horiz = T,col = c("black","blue","orange"),border=F)
summary(lm(E10_1~RiskPremiu+SMB2+HML2+RMW2+CMA2,factmerg)) ##等权收益回归
##
## Call:
## lm(formula = E10_1 ~ RiskPremiu + SMB2 + HML2 + RMW2 + CMA2,
##     data = factmerg)
##
## Residuals:
##      Min       1Q   Median       3Q      Max
## -0.18014 -0.04931 -0.02324  0.01269  0.90792
##
## Coefficients:
##              Estimate Std. Error t value Pr(>|t|)
## (Intercept)  0.044557   0.006007   7.417 1.07e-12 ***
## RiskPremiu  -0.033898   0.076087  -0.446   0.6562
## SMB2         0.146445   0.175643   0.834   0.4050
## HML2        -0.219871   0.208297  -1.056   0.2920
## RMW2        -0.293276   0.276469  -1.061   0.2896
## CMA2         0.476687   0.264965   1.799   0.0729 .
## ---
## Signif. codes:  0 '***' 0.001 '**' 0.01 '*' 0.05 '.' 0.1 ' ' 1
##
## Residual standard error: 0.1052 on 322 degrees of freedom
## Multiple R-squared:  0.06051,	Adjusted R-squared:  0.04592
## F-statistic: 4.148 on 5 and 322 DF,  p-value: 0.00115
分时间段
1995年1月至2005年12月(市值后30%的股票)

summary(lm(E10_1~RiskPremiu+SMB2+HML2+RMW2+CMA2,factmerg)) ##等权收益回归
##
## Call:
## lm(formula = E10_1 ~ RiskPremiu + SMB2 + HML2 + RMW2 + CMA2,
##     data = factmerg)
##
## Residuals:
##       Min        1Q    Median        3Q       Max
## -0.165240 -0.022961 -0.000835  0.020871  0.189560
##
## Coefficients:
##              Estimate Std. Error t value Pr(>|t|)
## (Intercept)  0.019299   0.004162   4.637 8.78e-06 ***
## RiskPremiu  -0.033037   0.049555  -0.667   0.5062
## SMB2         0.190584   0.105561   1.805   0.0734 .
## HML2        -0.162184   0.141180  -1.149   0.2528
## RMW2        -0.662848   0.153812  -4.309 3.28e-05 ***
## CMA2         0.172836   0.141656   1.220   0.2247
## ---
## Signif. codes:  0 '***' 0.001 '**' 0.01 '*' 0.05 '.' 0.1 ' ' 1
##
## Residual standard error: 0.0447 on 125 degrees of freedom
## Multiple R-squared:  0.3245,	Adjusted R-squared:  0.2975
## F-statistic: 12.01 on 5 and 125 DF,  p-value: 1.666e-09
2006年1月至2015年12月(市值后30%的股票)
summary(lm(E10_1~RiskPremiu+SMB2+HML2+RMW2+CMA2,factmerg)) ##等权收益回归
##
## Call:
## lm(formula = E10_1 ~ RiskPremiu + SMB2 + HML2 + RMW2 + CMA2,
##     data = factmerg)
##
## Residuals:
##      Min       1Q   Median       3Q      Max
## -0.13748 -0.07285 -0.04470  0.01622  0.87118
##
## Coefficients:
##             Estimate Std. Error t value Pr(>|t|)
## (Intercept)  0.07994    0.01440   5.551 1.88e-07 ***
## RiskPremiu   0.03520    0.16172   0.218    0.828
## SMB2         0.38135    0.49640   0.768    0.444
## HML2        -0.19345    0.48678  -0.397    0.692
## RMW2         0.28197    0.84849   0.332    0.740
## CMA2         0.42460    0.76162   0.557    0.578
## ---
## Signif. codes:  0 '***' 0.001 '**' 0.01 '*' 0.05 '.' 0.1 ' ' 1
##
## Residual standard error: 0.1494 on 114 degrees of freedom
## Multiple R-squared:  0.02651,	Adjusted R-squared:  -0.01619
## F-statistic: 0.6209 on 5 and 114 DF,  p-value: 0.6841
2016年1月至2022年5月(市值后30%的股票)

summary(lm(E10_1~RiskPremiu+SMB2+HML2+RMW2+CMA2,factmerg)) ##等权收益回归
##
## Call:
## lm(formula = E10_1 ~ RiskPremiu + SMB2 + HML2 + RMW2 + CMA2,
##     data = factmerg)
##
## Residuals:
##      Min       1Q   Median       3Q      Max
## -0.13577 -0.04418 -0.01493  0.01893  0.36234
##
## Coefficients:
##              Estimate Std. Error t value Pr(>|t|)
## (Intercept)  0.032632   0.009773   3.339  0.00143 **
## RiskPremiu   0.050855   0.246372   0.206  0.83714
## SMB2        -0.156735   0.397650  -0.394  0.69482
## HML2        -0.184786   0.571155  -0.324  0.74738
## RMW2         0.560557   0.582259   0.963  0.33942
## CMA2         1.554159   0.793301   1.959  0.05460 .
## ---
## Signif. codes:  0 '***' 0.001 '**' 0.01 '*' 0.05 '.' 0.1 ' ' 1
##
## Residual standard error: 0.078 on 62 degrees of freedom
## Multiple R-squared:  0.1148,	Adjusted R-squared:  0.04345
## F-statistic: 1.609 on 5 and 62 DF,  p-value: 0.171
总市值分组(市值前70%的股票)
pacman::p_load(data.table,stringr,dplyr,foreign,flextable)
options(warn = F)
fivefactort<-read.dbf("E:/科研/五因子模型指标(月)150835535/STK_MKT_FIVEFACMONTH.dbf")%>% ## 读入月度Fama-French五因子
  filter(Markettype=="P9714"&Portfolios==1)
## Field name: 'RiskPremiu' changed to: 'RiskPremiu.1'
stockret<-read.dbf("E:/科研/五因子模型指标(月)150835535/TRD_Mnth.dbf")                ##股票市值和收益数据

cleandata<-stockret%>%filter(as.character(Trdmnt)>="1995-01"&!str_detect(Stkcd,"^900|^200"))%>%
  group_by(Stkcd)%>%
  mutate(LMsmvosd=lag(Msmvosd),
  LMsmvttl=lag(Msmvttl))%>%ungroup()%>%
  group_by(Trdmnt)%>%
  filter(LMsmvttl>=quantile(LMsmvttl,0.3,na.rm=T))%>%
  mutate(Groupsd=cut(LMsmvosd,c(min(LMsmvosd)-100,quantile(LMsmvosd,seq(0.1,0.9,0.1),na.rm=T),max(LMsmvosd)+100),labels=1:10),
  Groupmvt=cut(LMsmvttl,c(min(LMsmvttl)-100,quantile(LMsmvttl,seq(0.1,0.9,0.1),na.rm=T),max(LMsmvttl)+100),labels=1:10))%>%
  select(Stkcd,Trdmnt,Groupsd,Groupmvt,Msmvttl,LMsmvttl,Mretnd)%>%
  ungroup()%>%
  na.omit()


Mvtotal<-cleandata%>%group_by(Trdmnt,Groupmvt)%>%
  summarise(Eqret=mean(Mretnd),Wiehtret=weighted.mean(Mretnd,LMsmvttl))%>%
  filter(Groupmvt%in%c(1,10))%>%
  as.data.frame()%>%
  reshape(idvar = "Trdmnt",timevar = "Groupmvt",direction = "wide")%>%
  mutate(E10_1=Eqret.1-Eqret.10,
  W10_1=Wiehtret.1-Wiehtret.10)
## `summarise()` has grouped output by 'Trdmnt'. You can override using the
## `.groups` argument.
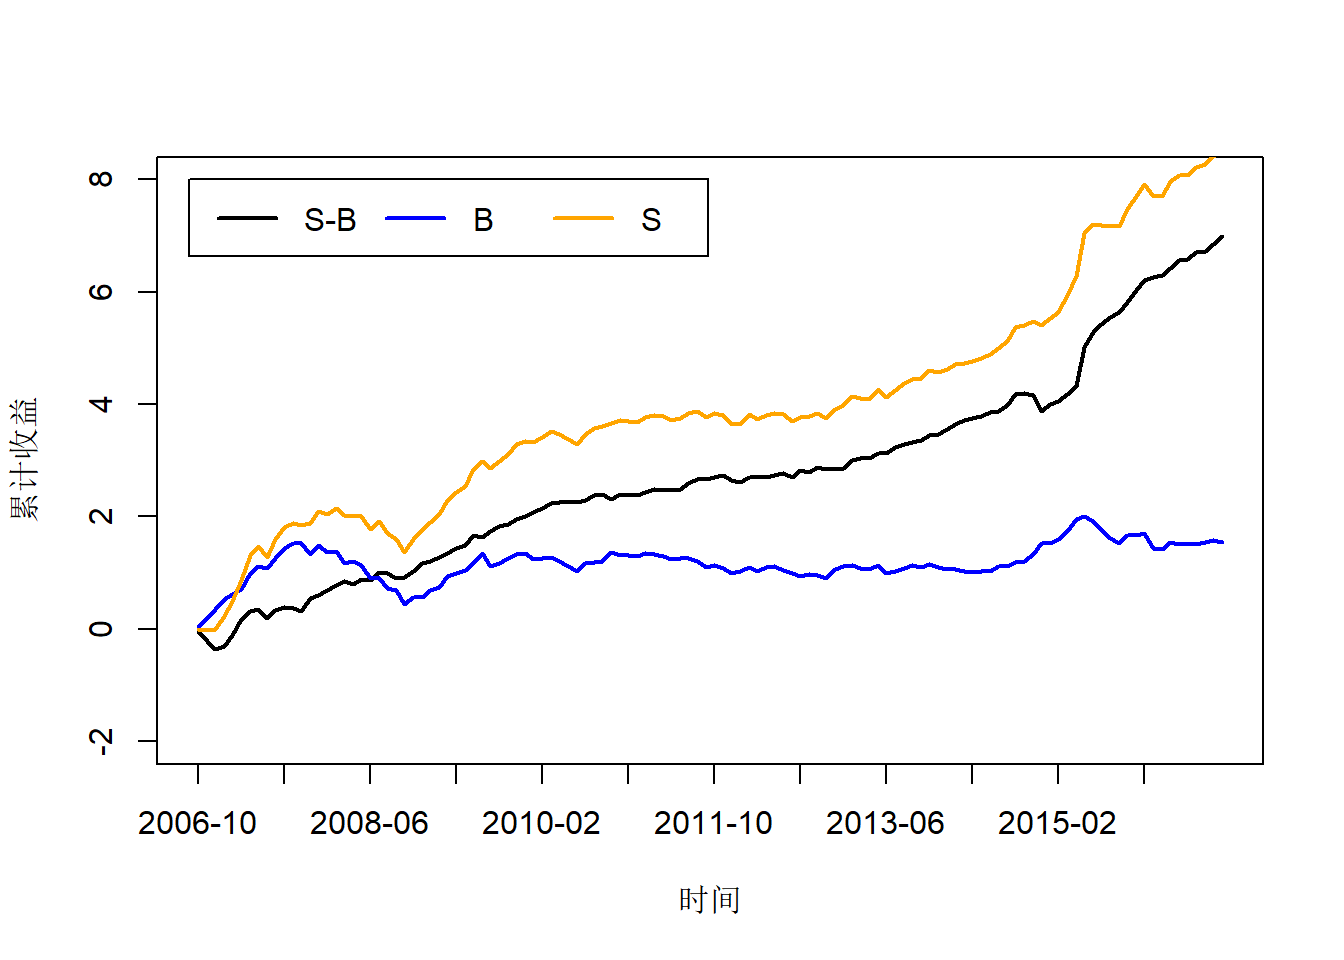
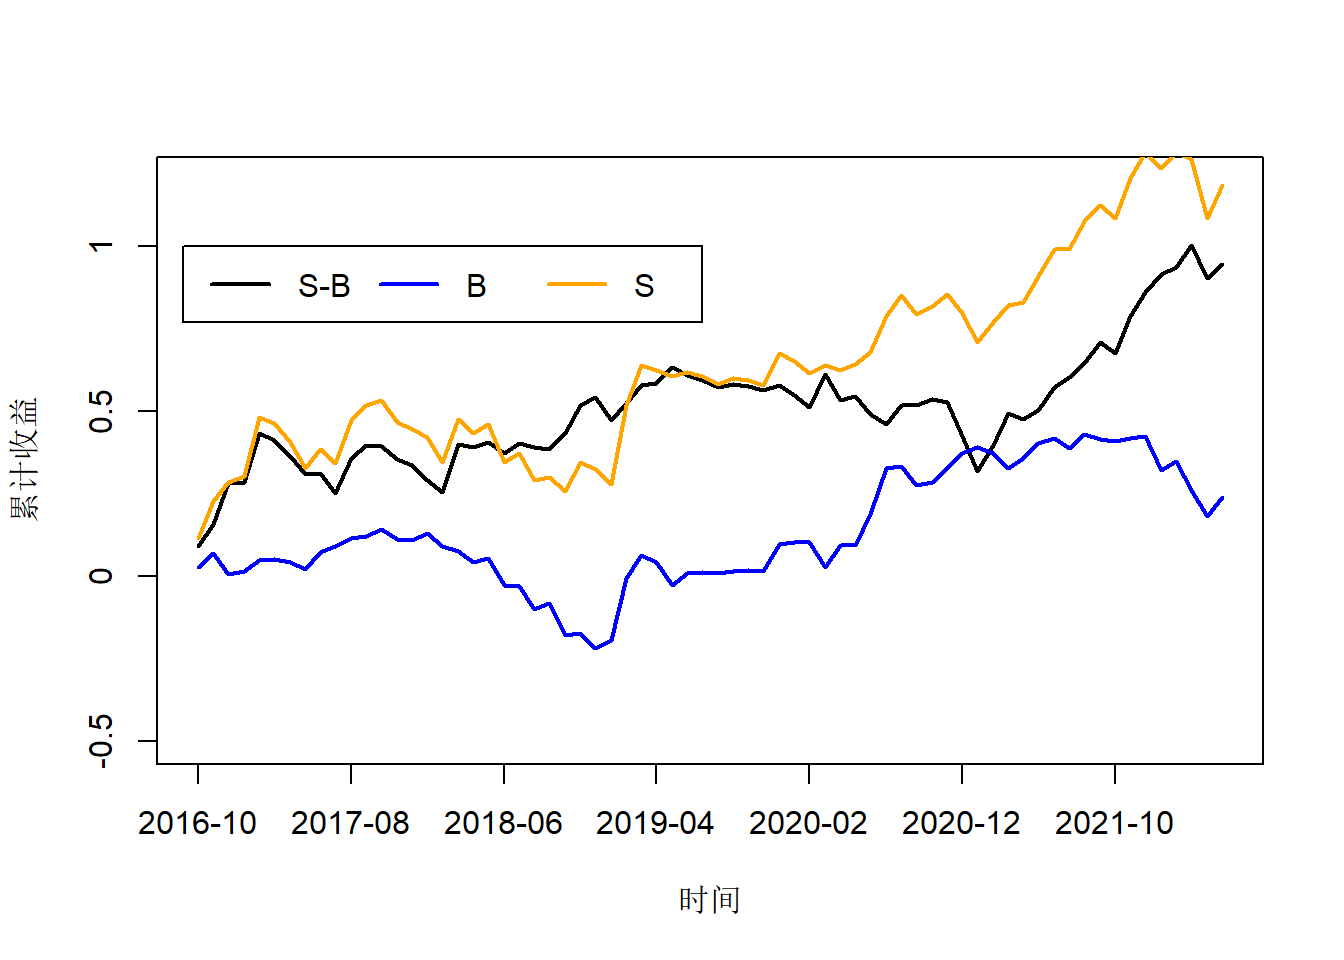
全时间段(市值前70%的股票)
factmerg<-Mvtotal%>%
mutate(TradingMon=Trdmnt)%>%
merge(fivefactort,by="TradingMon",all.x = T)%>%
mutate(cumretE10_1=cumsum(E10_1),
cumretE10=cumsum(Eqret.10),
cumretE1=cumsum(Eqret.1),
cumSMB=cumsum(SMB2))
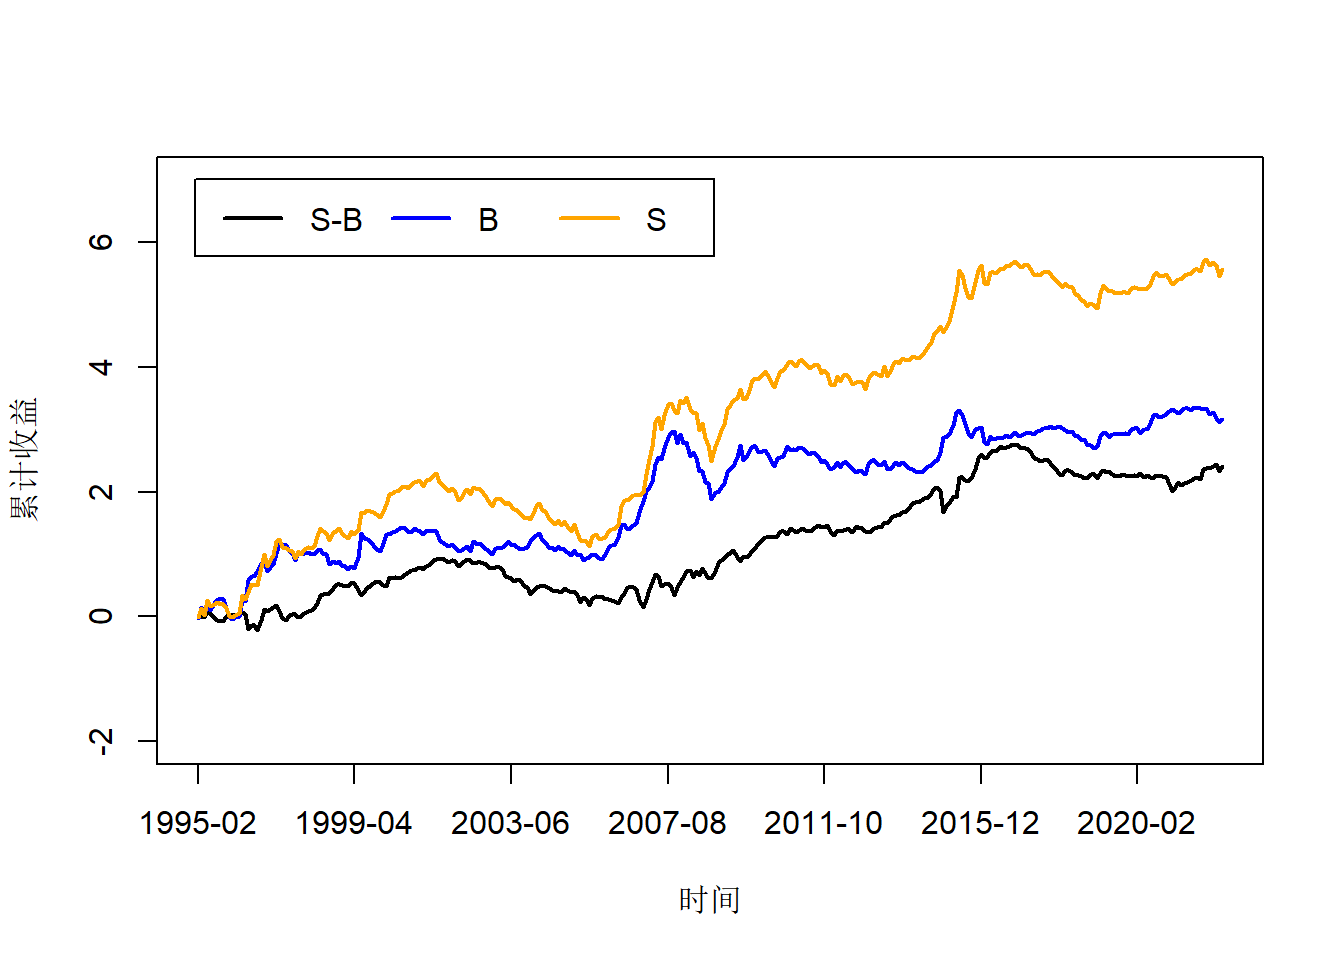
plot(factmerg$cumretE10_1,type="l",axes = F,ylab="累计收益",xlab="时间",lwd=2,ylim=c(-2,7))
axis(side =1,at=seq(1,length(factmerg$Trdmnt),50),
as.character(factmerg$Trdmnt[seq(1,length(factmerg$Trdmnt),50)]))
axis(side =2,at=seq(-2,7,2),seq(-2,7,2))
box(lty = "solid")
lines(factmerg$cumretE10,col="blue",lwd=2)
lines(factmerg$cumretE1,col="orange",lwd=2)
legend(0,7,c("S-B","B","S"),lty=c(1,1,1),lwd=c(2,2,2),
horiz = T,col = c("black","blue","orange"),border=F)
summary(lm(E10_1~RiskPremiu+SMB2+HML2+RMW2+CMA2,factmerg)) ##等权收益回归
##
## Call:
## lm(formula = E10_1 ~ RiskPremiu + SMB2 + HML2 + RMW2 + CMA2,
##     data = factmerg)
##
## Residuals:
##       Min        1Q    Median        3Q       Max
## -0.064015 -0.011468  0.000167  0.011395  0.120361
##
## Coefficients:
##              Estimate Std. Error t value Pr(>|t|)
## (Intercept) -0.000990   0.001225  -0.808 0.419674
## RiskPremiu  -0.059711   0.015518  -3.848 0.000144 ***
## SMB2         1.181872   0.035824  32.991  < 2e-16 ***
## HML2        -0.063171   0.042484  -1.487 0.138006
## RMW2        -0.117159   0.056388  -2.078 0.038526 *
## CMA2         0.226446   0.054041   4.190  3.6e-05 ***
## ---
## Signif. codes:  0 '***' 0.001 '**' 0.01 '*' 0.05 '.' 0.1 ' ' 1
##
## Residual standard error: 0.02146 on 322 degrees of freedom
## Multiple R-squared:  0.8915,	Adjusted R-squared:  0.8898
## F-statistic: 529.3 on 5 and 322 DF,  p-value: < 2.2e-16
分时间段
1995年1月至2005年12月(市值前70%的股票)
summary(lm(E10_1~RiskPremiu+SMB2+HML2+RMW2+CMA2,factmerg)) ##等权收益回归
##
## Call:
## lm(formula = E10_1 ~ RiskPremiu + SMB2 + HML2 + RMW2 + CMA2,
##     data = factmerg)
##
## Residuals:
##      Min       1Q   Median       3Q      Max
## -0.05833 -0.01488  0.00003  0.01311  0.12699
##
## Coefficients:
##               Estimate Std. Error t value Pr(>|t|)
## (Intercept) -0.0002171  0.0023075  -0.094  0.92520
## RiskPremiu  -0.0782494  0.0274730  -2.848  0.00514 **
## SMB2         1.0940116  0.0585219  18.694  < 2e-16 ***
## HML2        -0.2160831  0.0782691  -2.761  0.00664 **
## RMW2        -0.0862982  0.0852721  -1.012  0.31348
## CMA2         0.3119171  0.0785329   3.972  0.00012 ***
## ---
## Signif. codes:  0 '***' 0.001 '**' 0.01 '*' 0.05 '.' 0.1 ' ' 1
##
## Residual standard error: 0.02478 on 125 degrees of freedom
## Multiple R-squared:  0.8194,	Adjusted R-squared:  0.8122
## F-statistic: 113.5 on 5 and 125 DF,  p-value: < 2.2e-16
2006年1月至2015年12月(市值前70%的股票)
summary(lm(E10_1~RiskPremiu+SMB2+HML2+RMW2+CMA2,factmerg)) ##等权收益回归
##
## Call:
## lm(formula = E10_1 ~ RiskPremiu + SMB2 + HML2 + RMW2 + CMA2,
##     data = factmerg)
##
## Residuals:
##       Min        1Q    Median        3Q       Max
## -0.049351 -0.010849 -0.000959  0.011324  0.051726
##
## Coefficients:
##              Estimate Std. Error t value Pr(>|t|)
## (Intercept) -0.002148   0.001833  -1.172    0.244
## RiskPremiu  -0.026381   0.020584  -1.282    0.203
## SMB2         1.364626   0.063187  21.597   <2e-16 ***
## HML2         0.072837   0.061961   1.176    0.242
## RMW2         0.010440   0.108003   0.097    0.923
## CMA2         0.159824   0.096945   1.649    0.102
## ---
## Signif. codes:  0 '***' 0.001 '**' 0.01 '*' 0.05 '.' 0.1 ' ' 1
##
## Residual standard error: 0.01902 on 114 degrees of freedom
## Multiple R-squared:  0.9431,	Adjusted R-squared:  0.9406
## F-statistic: 378.1 on 5 and 114 DF,  p-value: < 2.2e-16
2016年1月至2022年5月(市值前70%的股票)
summary(lm(E10_1~RiskPremiu+SMB2+HML2+RMW2+CMA2,factmerg)) ##等权收益回归
##
## Call:
## lm(formula = E10_1 ~ RiskPremiu + SMB2 + HML2 + RMW2 + CMA2,
##     data = factmerg)
##
## Residuals:
##       Min        1Q    Median        3Q       Max
## -0.026316 -0.009942  0.000277  0.008405  0.055846
##
## Coefficients:
##               Estimate Std. Error t value Pr(>|t|)
## (Intercept)  0.0004343  0.0019095   0.227 0.820842
## RiskPremiu   0.0008215  0.0481379   0.017 0.986439
## SMB2         1.3005844  0.0776957  16.739  < 2e-16 ***
## HML2         0.4035263  0.1115964   3.616 0.000602 ***
## RMW2        -0.3100346  0.1137660  -2.725 0.008341 **
## CMA2        -0.1796167  0.1550010  -1.159 0.250978
## ---
## Signif. codes:  0 '***' 0.001 '**' 0.01 '*' 0.05 '.' 0.1 ' ' 1
##
## Residual standard error: 0.01524 on 62 degrees of freedom
## Multiple R-squared:  0.9128,	Adjusted R-squared:  0.9057
## F-statistic: 129.7 on 5 and 62 DF,  p-value: < 2.2e-16
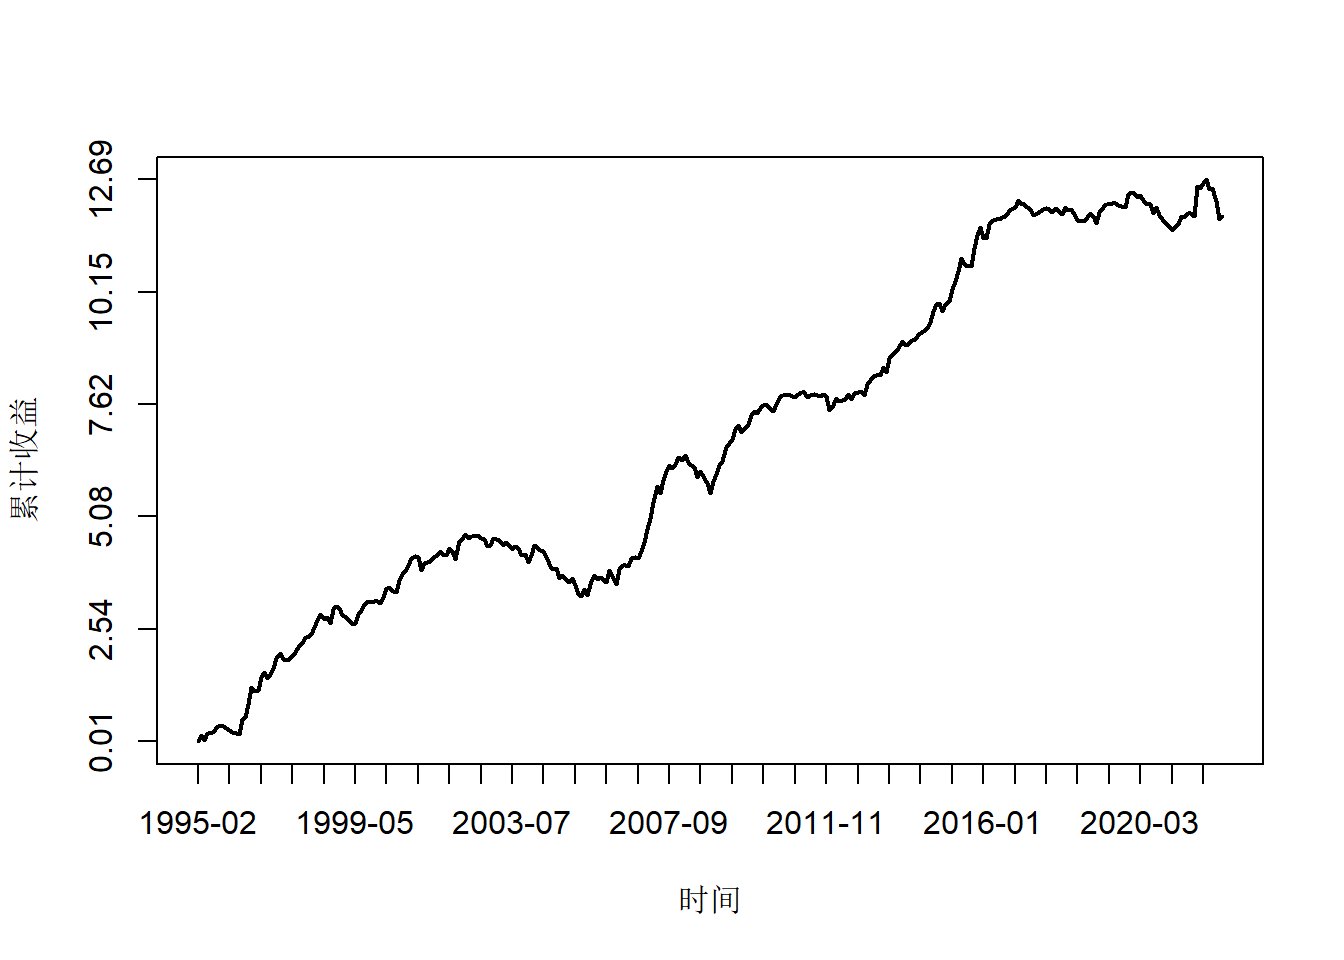
总市值分组(市值后5的股票)
pacman::p_load(data.table,stringr,dplyr,mongolite,foreign,flextable)
options(warn = F)
stockret<-read.dbf("E:/科研/五因子模型指标(月)150835535/TRD_Mnth.dbf") ##股票市值和收益数据
#
# cleandata<-stockret%>%filter(as.character(Trdmnt)>="1995-01"&!str_detect(Stkcd,"^900|^200"))%>%
# group_by(Stkcd)%>%
# mutate(LMsmvosd=lag(Msmvosd),
# LMsmvttl=lag(Msmvttl))%>%ungroup()%>%filter(!is.na(LMsmvosd)&!is.na(LMsmvttl))%>%
# group_by(Trdmnt)%>%
# filter(LMsmvttl<=quantile(LMsmvttl,0.3,na.rm=T))%>%
# mutate(Groupsd=cut(LMsmvosd,c(min(LMsmvosd)-100,quantile(LMsmvosd,seq(0.1,0.9,0.1),na.rm=T),max(LMsmvosd)+100),labels=1:10),
# Groupmvt=cut(LMsmvttl,c(min(LMsmvttl)-100,quantile(LMsmvttl,seq(0.1,0.9,0.1),na.rm=T),max(LMsmvttl)+100),labels=1:10))%>%
# select(Stkcd,Trdmnt,Groupsd,Groupmvt,Msmvttl,LMsmvttl,Mretnd)%>%
# ungroup()%>%
# na.omit()
#
#
# Mvtotal<-cleandata%>%filter(Groupmvt%in%c(1))%>%
# arrange(Trdmnt,LMsmvttl,Groupmvt)%>%
# group_by(Trdmnt,Groupmvt)%>%
# mutate(num=1:n())%>%filter(num<=5)%>%
# summarise(Eqret=mean(Mretnd))%>%ungroup()%>%
# mutate(Eret=cumsum(Eqret))
# mdat<-mongo(collection = "trademonthly",db="stockdata")
# datamoth<-mdat$find(query='{}')
# tsdate<-unique(datamoth$trade_date)
# tdate<-paste0("[\"",paste0(tsdate,collapse = "\",\""),"\"]")
# dailydat<-mongo(collection = "dailybasic",db="stockdata")
# mdatas<-dailydat$find(query=paste0("{\"trade_date\":{\"$in\":",tdate,"}}"),
# fields = '{"_id":0,"ts_code":1,"trade_date":1,"total_mv":1,"circ_mv":1}')%>%
# mutate(across(.cols =total_mv:circ_mv,as.numeric ))
# cleandata<-merge(mdatas,datamoth,by=c("ts_code","trade_date"),all.y = T)%>%
# mutate(Trdmnt=gsub("(\\d{4})(\\d{2})(\\d{2})","\\1-\\2",trade_date),
# Mretnd=change/pre_close)%>%
# filter(Trdmnt>="1995-01")%>%
# group_by(ts_code)%>%
# mutate(LMsmvosd=lag(circ_mv),
# LMsmvttl=lag(total_mv))%>%ungroup()%>%filter(!is.na(LMsmvttl))%>%
# ungroup()%>%
# group_by(Trdmnt)%>%arrange(LMsmvttl)%>%summarise_all(head,5)%>%
# select(ts_code,Trdmnt,LMsmvttl,Mretnd)%>%
# ungroup()%>%
# na.omit()
#
# Mvtota<-cleandata%>%
# group_by(Trdmnt)%>%
# summarise(Eqret=mean(Mretnd))%>%ungroup()%>%
# mutate(Eret=cumsum(Eqret))
mdat<-mongo(collection = "stockbase",db="stockdata")
stocbas<-mdat$find(query='{}')%>%
mutate(Stkcd=symbol)%>%select(Stkcd,list_date)
cleandata<-stockret%>%filter(as.character(Trdmnt)>="1995-01"&!str_detect(Stkcd,"^900|^200")&Mretnd<1.5)%>%
merge(stocbas,by="Stkcd",all.x = T)%>%
mutate(tradedate=paste0(paste0(Trdmnt,"-",Clsdt)))%>%
group_by(Stkcd)%>%arrange(Stkcd,Trdmnt)%>%
mutate(Ldate=lag(tradedate),
LMsmvosd=lag(Msmvosd),
LMsmvttl=lag(Msmvttl))%>%
mutate(datelist=as.numeric(as.Date(paste0(Trdmnt,"-",Clsdt))-as.Date(list_date,"%Y%m%d")),
datedr=as.numeric(as.Date(tradedate)-as.Date(Ldate)))%>%
filter(datelist>120&datedr<42)%>%ungroup()%>%filter(!is.na(LMsmvttl))%>%
group_by(Trdmnt)%>%arrange(LMsmvttl)%>%summarise_all(head,5)%>%
select(Stkcd,Trdmnt,Msmvttl,LMsmvttl,Mretnd)%>%
ungroup()%>%
na.omit()
Mvtotal<-cleandata%>%
group_by(Trdmnt)%>%
summarise(Eqret=mean(Mretnd))%>%ungroup()%>%
mutate(Eret=cumsum(Eqret))
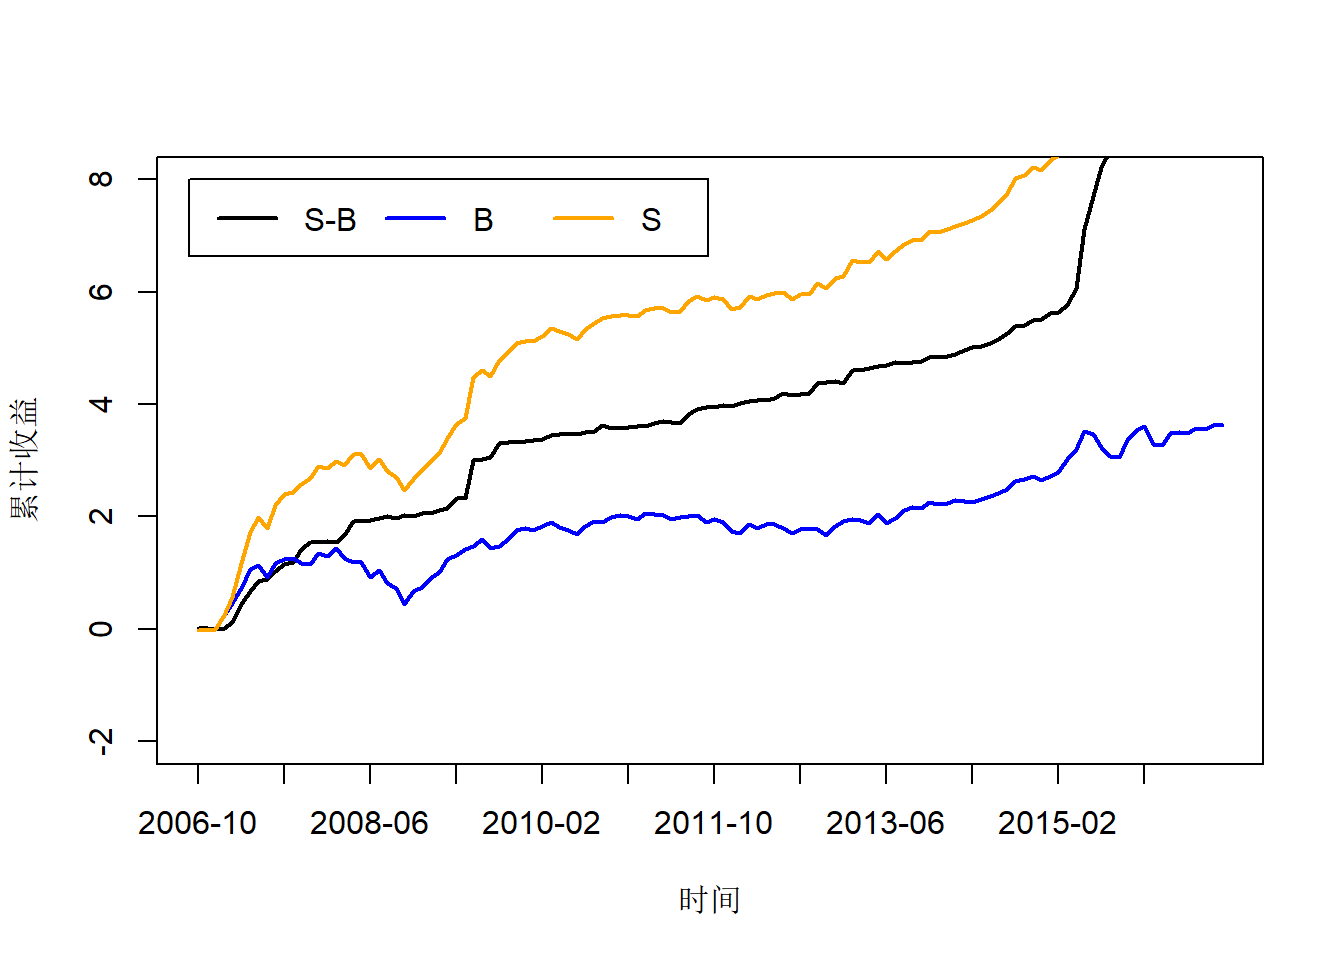
plot(Mvtotal$Eret,type="l",axes = F,ylab="累计收益",xlab="时间",lwd=2)
axis(side =1,at=seq(1,length(Mvtotal$Trdmnt),10),
as.character(Mvtotal$Trdmnt[seq(1,length(Mvtotal$Trdmnt),10)]))
axis(side =2,at=seq(min(Mvtotal$Eret),max(Mvtotal$Eret),(max(Mvtotal$Eret)-min(Mvtotal$Eret))/5),round(seq(min(Mvtotal$Eret),max(Mvtotal$Eret),(max(Mvtotal$Eret)-min(Mvtotal$Eret))/5),2))
box(lty = "solid")
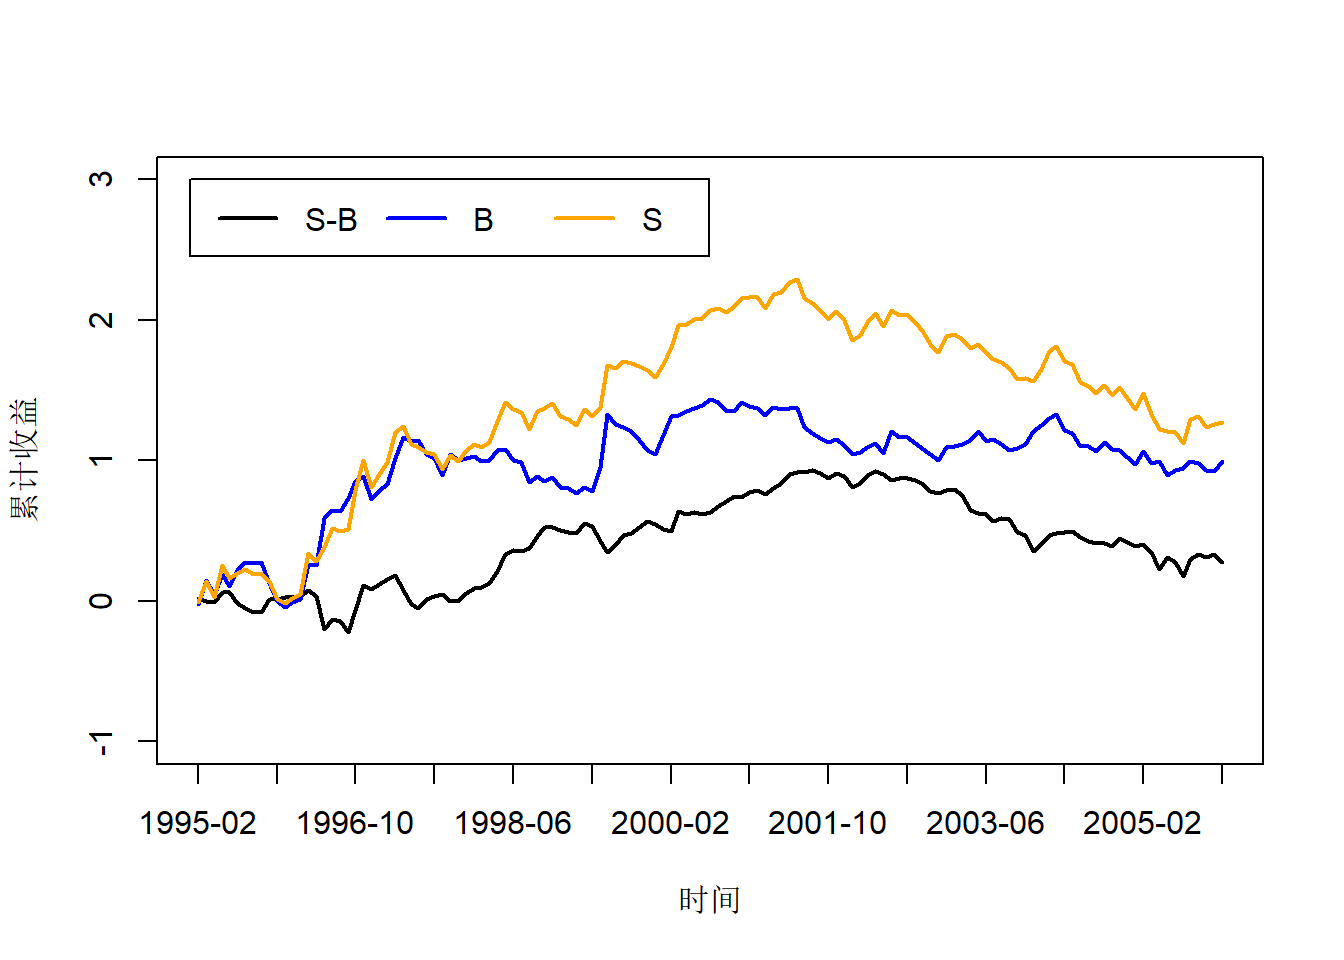
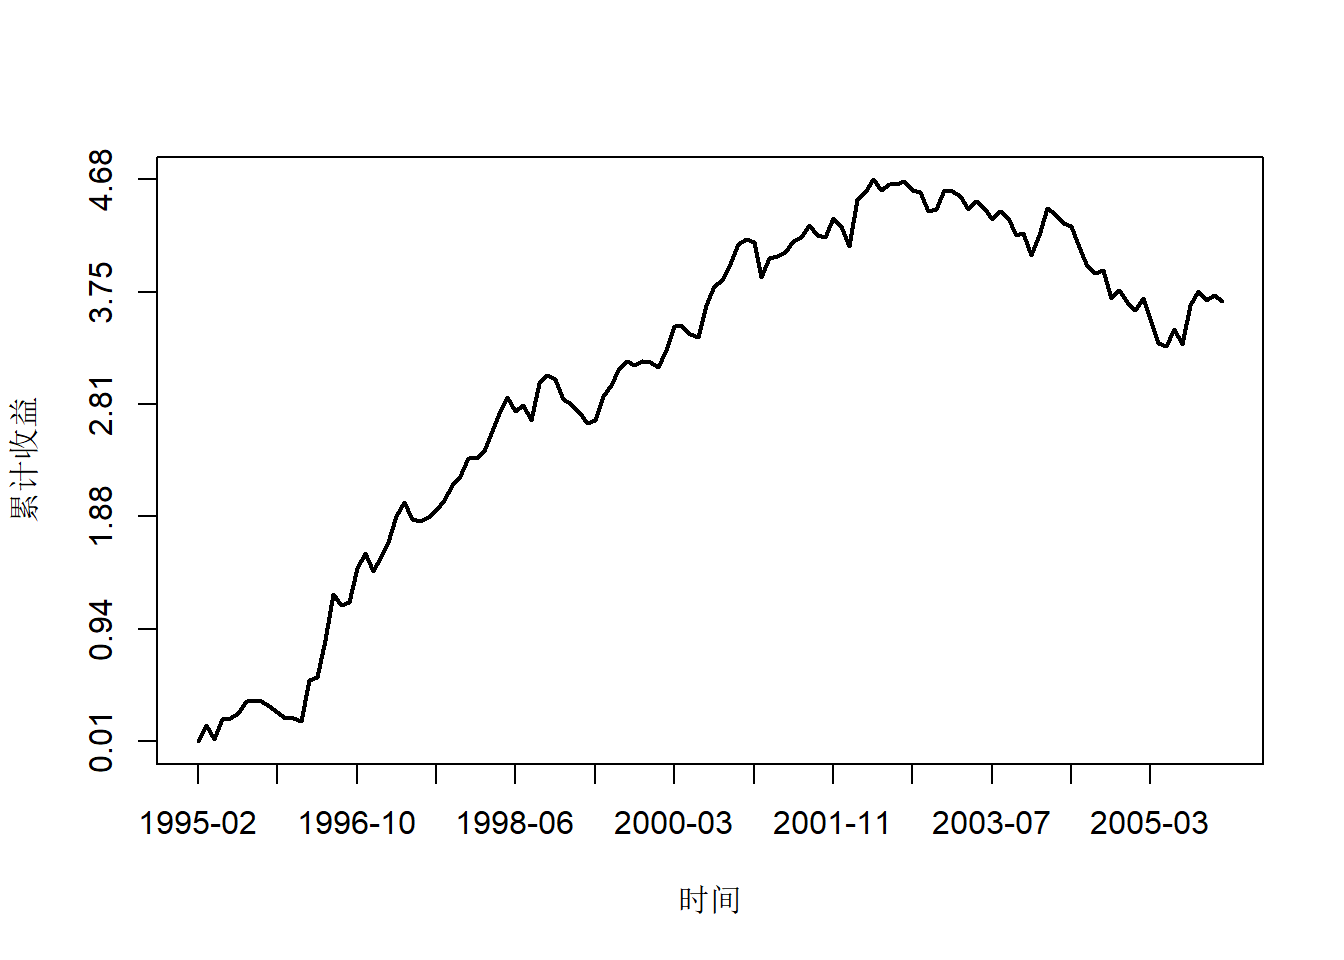
1995年1月至2005年12月(市值后5只股票)
Mvtotal<-cleandata%>%filter(as.character(Trdmnt)<="2005-12")%>%
  group_by(Trdmnt)%>%
  summarise(Eqret=mean(Mretnd))%>%ungroup()%>%
  mutate(Eret=cumsum(Eqret))

# Mvtotal<-cleandata%>%filter(Groupmvt%in%c(1))%>%filter(as.character(Trdmnt)<="2005-12")%>%
#   arrange(Trdmnt,LMsmvttl,Groupmvt)%>%
#   group_by(Trdmnt,Groupmvt)%>%
#   mutate(num=1:n())%>%filter(num<=5)%>%
#   summarise(Eqret=mean(Mretnd))%>%ungroup()%>%
#   mutate(Eret=cumsum(Eqret))

plot(Mvtotal$Eret,type="l",axes = F,ylab="累计收益",xlab="时间",lwd=2)
axis(side =1,at=seq(1,length(Mvtotal$Trdmnt),10),
as.character(Mvtotal$Trdmnt[seq(1,length(Mvtotal$Trdmnt),10)]))
axis(side =2,at=seq(min(Mvtotal$Eret),max(Mvtotal$Eret),(max(Mvtotal$Eret)-min(Mvtotal$Eret))/5),round(seq(min(Mvtotal$Eret),max(Mvtotal$Eret),(max(Mvtotal$Eret)-min(Mvtotal$Eret))/5),2))
box(lty = "solid")
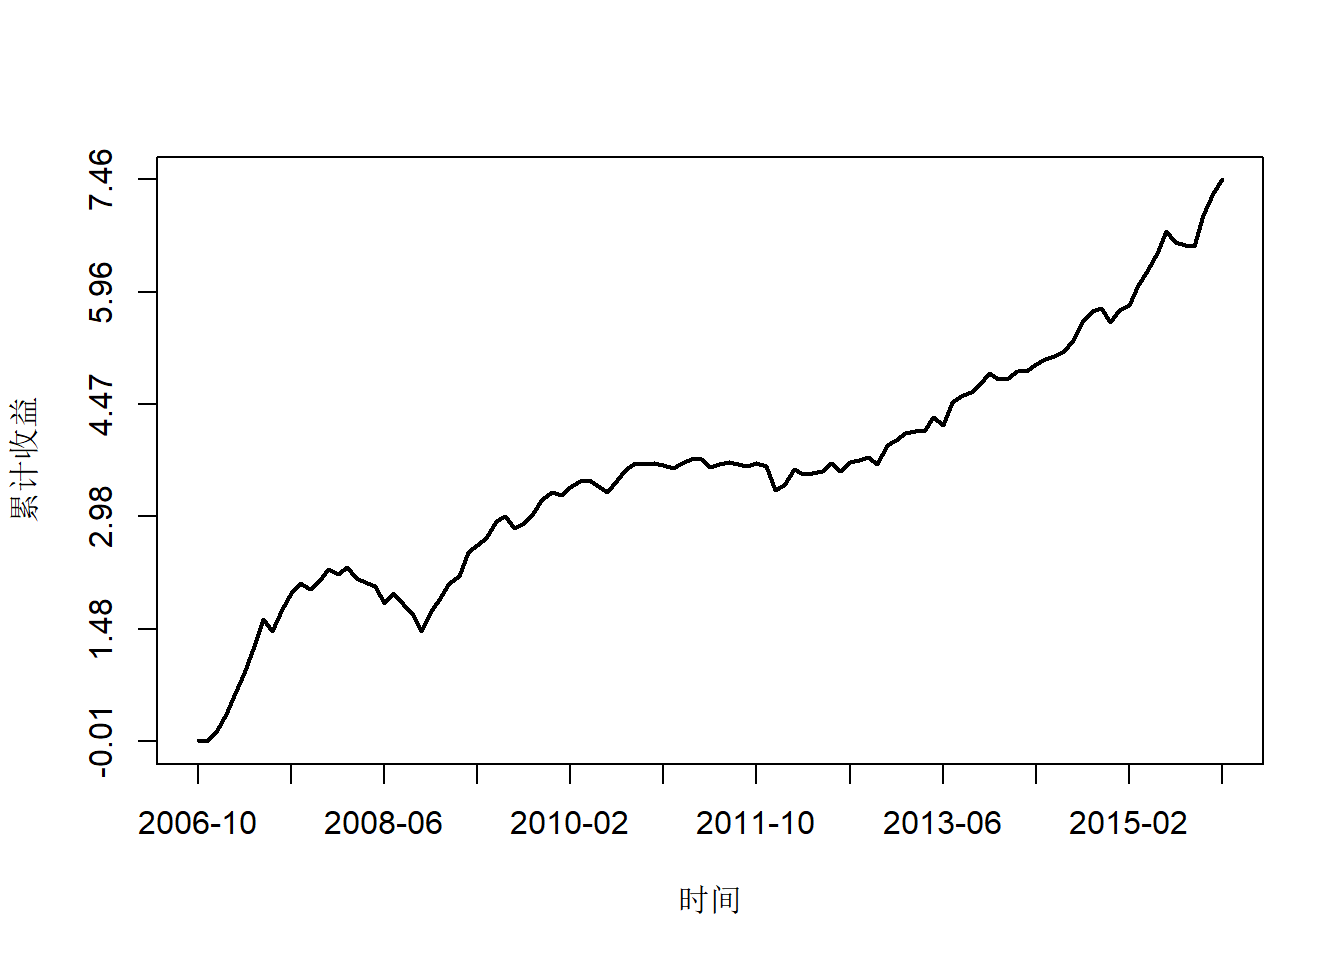
2006年1月至2015年12月(市值后5只股票)
Mvtotal<-cleandata%>%
  filter(as.character(Trdmnt)>="2006-1"&as.character(Trdmnt)<="2015-12")%>%
  group_by(Trdmnt)%>%
  summarise(Eqret=mean(Mretnd))%>%ungroup()%>%
  mutate(Eret=cumsum(Eqret))

# Mvtotal<-cleandata%>%filter(Groupmvt%in%c(1))%>%
#   filter(as.character(Trdmnt)>="2006-1"&as.character(Trdmnt)<="2015-12")%>%
#   arrange(Trdmnt,LMsmvttl,Groupmvt)%>%
#   group_by(Trdmnt,Groupmvt)%>%
#   mutate(num=1:n())%>%filter(num<=5)%>%
#   summarise(Eqret=mean(Mretnd))%>%ungroup()%>%
#   mutate(Eret=cumsum(Eqret))

plot(Mvtotal$Eret,type="l",axes = F,ylab="累计收益",xlab="时间",lwd=2)
axis(side =1,at=seq(1,length(Mvtotal$Trdmnt),10),
as.character(Mvtotal$Trdmnt[seq(1,length(Mvtotal$Trdmnt),10)]))
axis(side =2,at=seq(min(Mvtotal$Eret),max(Mvtotal$Eret),(max(Mvtotal$Eret)-min(Mvtotal$Eret))/5),round(seq(min(Mvtotal$Eret),max(Mvtotal$Eret),(max(Mvtotal$Eret)-min(Mvtotal$Eret))/5),2))
box(lty = "solid")
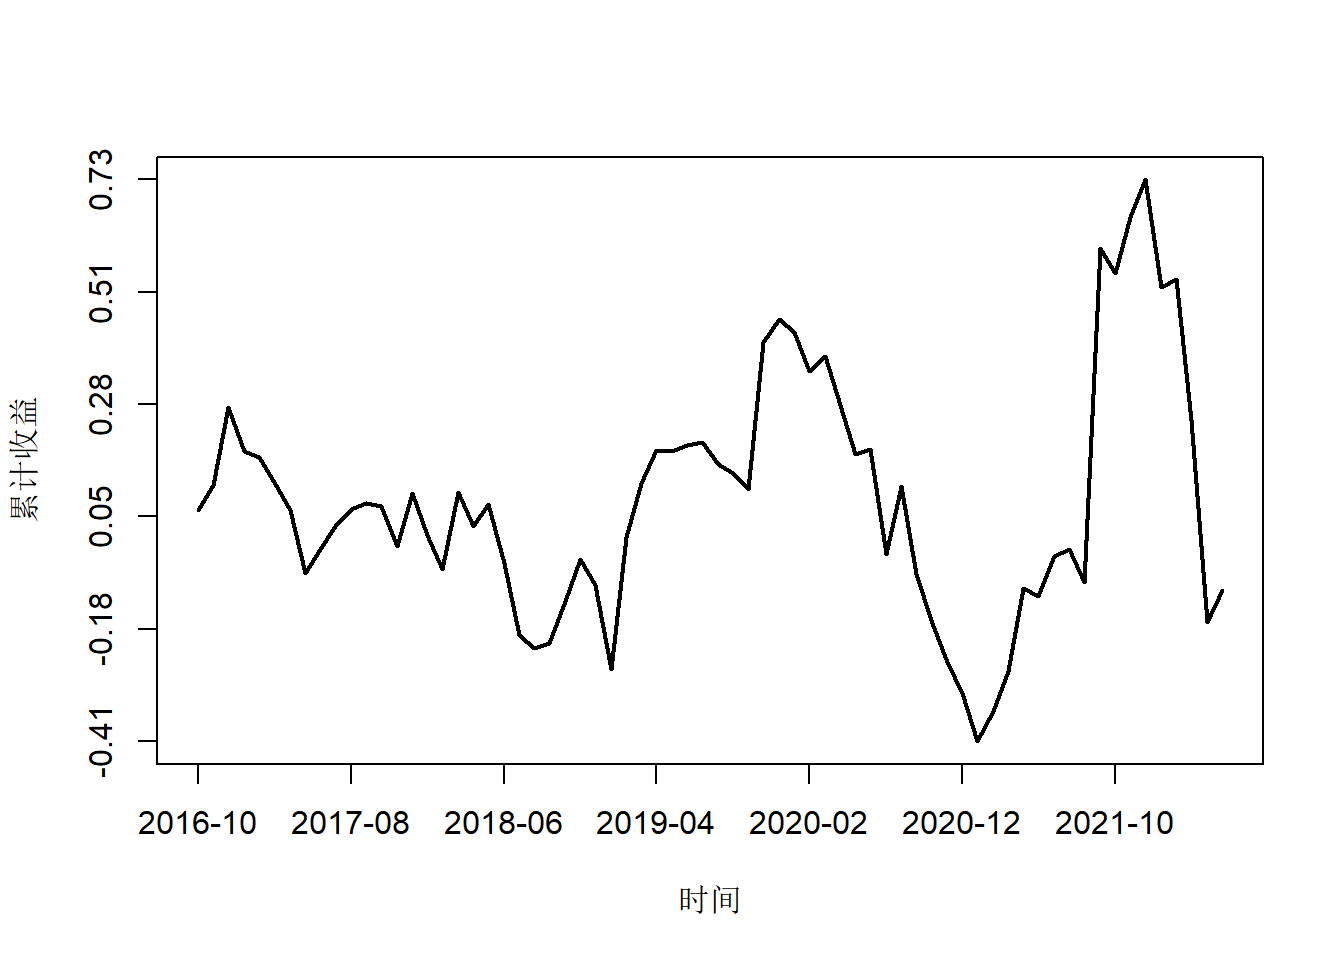
2016年1月至2022年5月(市值后5只股票)
Mvtotal<-cleandata%>%
  filter(as.character(Trdmnt)>="2016-1")%>%
  group_by(Trdmnt)%>%
  summarise(Eqret=mean(Mretnd))%>%ungroup()%>%
  mutate(Eret=cumsum(Eqret))

# Mvtotal<-cleandata%>%filter(Groupmvt%in%c(1))%>%
#   filter(as.character(Trdmnt)>="2016-1")%>%
#   arrange(Trdmnt,LMsmvttl,Groupmvt)%>%
#   group_by(Trdmnt,Groupmvt)%>%
#   mutate(num=1:n())%>%filter(num<=5)%>%
#   summarise(Eqret=mean(Mretnd))%>%ungroup()%>%
#   mutate(Eret=cumsum(Eqret))

plot(Mvtotal$Eret,type="l",axes = F,ylab="累计收益",xlab="时间",lwd=2)
axis(side =1,at=seq(1,length(Mvtotal$Trdmnt),10),
as.character(Mvtotal$Trdmnt[seq(1,length(Mvtotal$Trdmnt),10)]))
axis(side =2,at=seq(min(Mvtotal$Eret),max(Mvtotal$Eret),(max(Mvtotal$Eret)-min(Mvtotal$Eret))/5),round(seq(min(Mvtotal$Eret),max(Mvtotal$Eret),(max(Mvtotal$Eret)-min(Mvtotal$Eret))/5),2))
box(lty = "solid")